

Imagine having a macro “money pulse” that often predicts Bitcoin’s next big move. Liquidity—the flow of money globally—has been this pulse for BTC. But lately, a newer, more precise signal has emerged that insiders are using to time their moves.
Global M2 Money Supply & Its Long-Term Liquidity Forecast

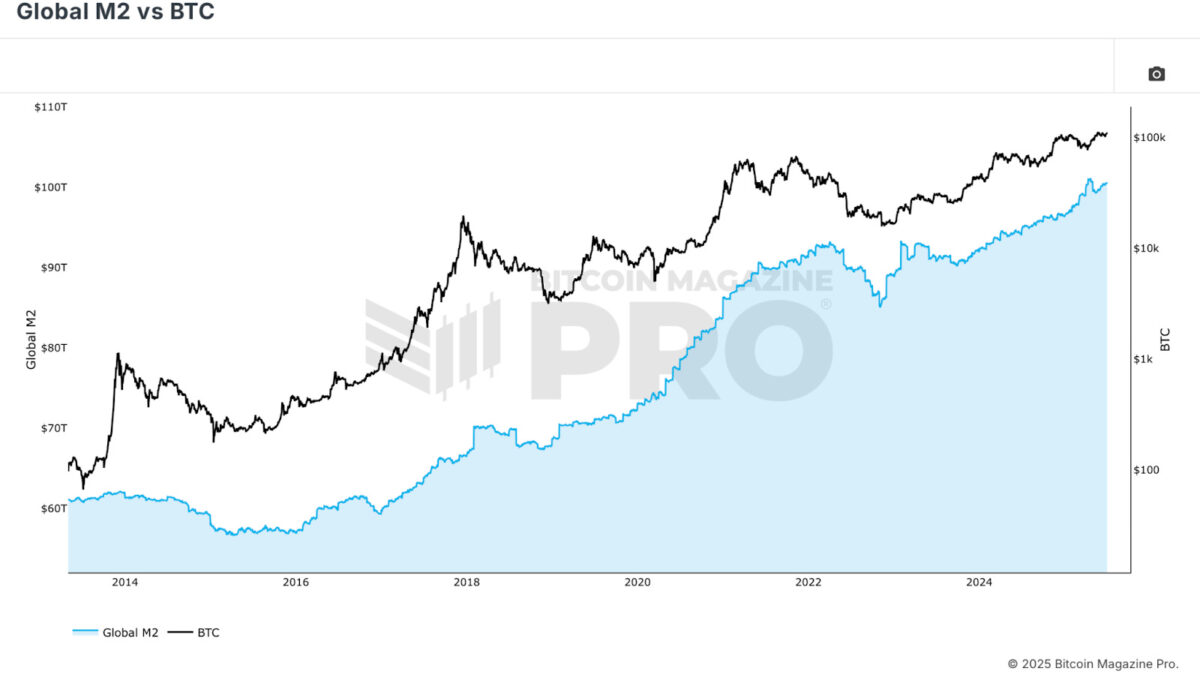
We begin with Global M2, a broad measure of fiat liquidity, and its connection to Bitcoin’s multi-year cycles.
Global M2 includes all physical currency plus near-money assets across major economies. When central banks pump money into the system—through lower rates or bond-buying—it shows up here. Historically, spikes in M2 (like during 2016–17 or 2020–21 stimulus) set the stage for Bitcoin’s biggest rallies. But M2 data is slow and delayed, making it useful for macro trend analysis, not short-term timing.
Stablecoin Liquidity – A Faster, Crypto-Native Signal
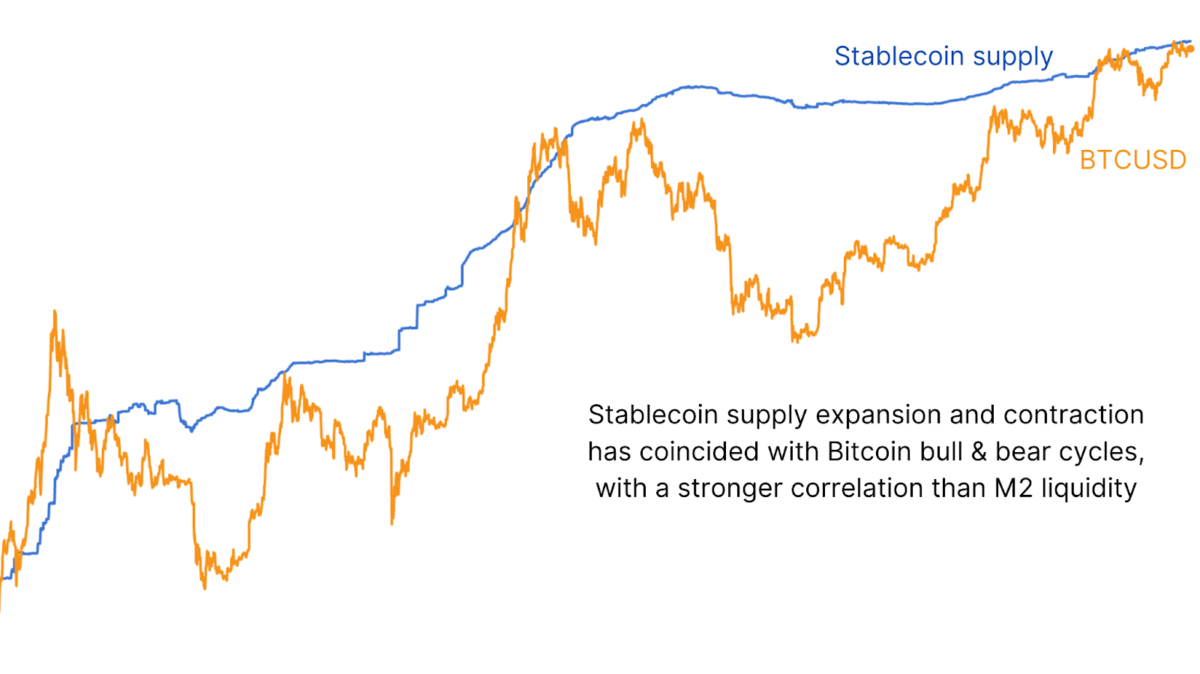
Zoom in on stablecoins—USDT, USDC, DAI—and why their supply acts like a live gauge of liquidity.
Crypto traders have long watched Tether “printing” as a lead signal. Today, tracking monthly changes in stablecoin supply offers a real-time view of capital flowing into risk assets. A rising 28-day rate-of-change tends to align with BTC accumulation, while a sharp drop aligns with tops and retracements . For example, late 2024’s uptick in stablecoin supply matched Bitcoin breaking out from consolidation, while early 2025’s supply drop preceded a ~30% correction.
The Future of Bitcoin Lies in Liquidity
Practical steps for applying both global and stablecoin liquidity insights in your investment or trading strategy.


Summary:
- Macro View: Monitor global M2 YoY growth—when it accelerates, BTC tends to follow after a 1–2 month lag .
- Tactical Entry: Track the 28-day stablecoin supply growth. Buy when this rate crosses from negative to positive.
- Scaling and Exits: Consider taking profits when this rate spikes at extreme highs.
- Combine Signals: Use global M2 for context and stablecoin data for real-time actions. Together they help balance long-term conviction and short-term tactics.
Final Takeaway – Global M2 remains a powerful


Global M2 remains a powerful long-term indicator of Bitcoin’s trajectory, reflecting government-driven liquidity cycles. But today’s market moves much faster. Monitoring the 28-day growth of stablecoin supply gives you a live feed of crypto-specific money flow—a tool that’s been reliable in identifying accumulation phases or warning signs ahead of corrections.
A savvy strategy: Use global M2 for trend context, stablecoin rate-of-change for timing moves. Whether you’re a long-term investor or short-term trader, incorporating both offers actionable, research-backed clarity.
Latest Crypto News;
- After 14 Years Two Mysterious Bitcoin Wallets have Moved 20,000 BTC
- 3 Key Drivers of Bitcoin’s Upcoming Breakout
- Coinbase Buys Liquifi While Tether Faces $4B Lawsuit
- Bitcoin ETF Momentum, Trump-Backed Bitcoin Mining,
- Crypto Market News & Updates Jun 30, 2025
- Robinhood Launches Micro Bitcoin, Solana, and XRP Futures
- Bitcoin Hits $40B in Derivative Market
- Why US Crypto Stocks Surged?
- Crypto News: Bitcoin Rebounds, Coinbase MiCA license, OKX IPO
- 7 Real-Time Shifts Driving Fear and Opportunity in the Crypto Market
- Solana, XRP, and Dogecoin ETFs
- Project 11 Raised $6M to Fix Flaw Behind Bitcoin’s Iron Wall
- Bitcoin Mining Moves to the U.S. as Trade War and Security Fears Grow
- Crypto News Flash: Metaplanet Surpasses Coinbase,