

Bitcoin and crypto markets dipped after the Fed signaled ongoing inflation concerns, sparking short-term sell-offs. But analysts expect the rally to bounce back, pointing to strong ETF inflows and corporate adoption. Meanwhile, Don Jr. and Eric Trump made waves at Bitcoin 2025, predicting BTC could surge past $170K by 2026.
Bitcoin (BTC/USD) Technical Analysis (1D) – Short & Long-Term Outlook
1. Price Action Overview
Bitcoin is currently trading at $106,244, down 1.47% on the day. The chart displays two major bullish cycles:
- Recent High: $112,000
- Predicted High: $132,400
BTC Price is in a healthy uptrend supported by a clear structure of higher lows and higher highs.

2. BTC Support and Resistance Levels
Immediate Resistance Levels:
- $110,000 – $112,000: New all time high & psychological resistance.
Immediate Support Levels:
- $101,445: Strong short-term support, aligned with blue horizontal support zone.
- $97,291 (50 SMA): Key dynamic support. A drop below this may indicate a trend reversal.
- $90,000: Major support base from consolidation zone.
3. BTC Moving Averages (50 SMA Analysis)
- The 50-day Simple Moving Average (SMA) is currently sitting at $97,291.
- BTC is trading above the 50 SMA, confirming a bullish trend.
- Historically, bounces from the 50 SMA have triggered large upward moves, making it a critical level for bulls to defend.
4. BTC RSI Analysis (Relative Strength Index)
- Current RSI = 67.62, previously peaked above 70.
- The RSI is below overbought territory, signaling strong momentum but with a risk of short-term correction.
- If RSI cools down to 50–55 while price remains stable, it may create a fresh leg upward.
5. BTC Trend Line Insights
- Trend line from previous local lows shows an ascending structure. BTC continues to respect this trend line support, which adds further bullish confirmation.
- A break below this ascending trend line would signal weakness, with potential pullback to the 50 SMA or below.
6. BTC Volume and Market Sentiment
- Volume is healthy but not yet at euphoric levels, suggesting more room for growth.
- Sentiment remains bullish, driven by macro factors like institutional inflow, rising ETF interest, and global inflation hedges.
7. Bitcoin Market Sentiment Shifts to Neutral
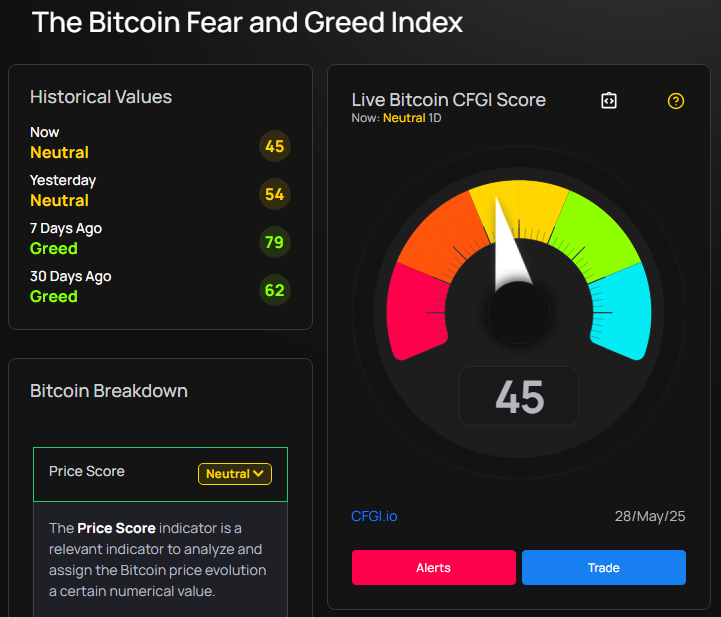
The Bitcoin Fear and Greed Index has dropped to 45, signaling a neutral market sentiment. This shift comes after a period of greed, with the index reaching 79 just a week ago. The current neutral score indicates that investors are no longer extremely optimistic or pessimistic about Bitcoin’s price movements. With the market sentiment now balanced, investors may be waiting for new developments before making their next move.
8. Short-Term Prediction (Next 2 Weeks)
Bullish Scenario:
- A bounce from $106,000 with RSI stabilizing could push BTC toward $110,000 and retest $112,000.
- If broken with volume, BTC could retest its $120,000 within weeks.
Bearish Scenario:
- Failure to hold above $101,000 or a breakdown below the 50 SMA could result in a drop to $95,000 – $97,000, forming a new base.
9. Long-Term Outlook (Next 3–6 Months)
- As long as Bitcoin maintains the higher low pattern, it’s likely to to hit $128,000 to $132,400 and potentially break toward $150,000, depending on macroeconomic trends and ETF flows.
- A clean breakout above $120,000 could trigger an extended bull cycle, similar to 2020–2021 patterns.
FAQs
Q1: Is Bitcoin still in a bullish trend?
Yes. Bitcoin is forming higher highs and higher lows, trading above the 50 SMA, and maintaining strong RSI momentum. These are all signs of a bullish trend.
Q2: What is the key level to watch for BTC support?
$101,445 is immediate support based on 1D time frame, while the 50 SMA at $97,291 is the critical line that must hold to sustain bullish structure.
Q3: Can Bitcoin reach $150,000 this cycle?
If BTC breaks and holds above $120,000 with strong volume, and macro conditions remain favorable, $150,000 is a realistic long-term target.
Q4: Is Bitcoin overbought now?
Not yet. RSI at 67 shows strong momentum but still has room to climb before hitting extreme overbought levels.
Q5: What could invalidate the bullish setup?
A decisive break below the 50 SMA with increasing selling volume may invalidate the current bullish structure and send BTC into a corrective phase.
Disclaimer: This article is for informational purposes only and does not constitute financial advice. Price predictions are speculative and based on current market data, technical indicators, and sentiment—accuracy is not guaranteed. Always do your own research and consult with a licensed financial advisor before making any investment decisions.
Latest Crypto News:
- Bitcoin Hits New All-Time High: What’s Next?
- How High Can Bitcoin Go in 2025?
- Ripple to Unlock 1 Billion XRP in June 2025
- Ripple joins Hands With Zand Bank and Mamo
- Is XRP Worth Buying? Can XRP Reach $10?
- Ripple Vs SEC Settlement Rejected
- XRP Price Prediction: Massive XRP Breakout Coming?
- XRP News Today: Ripple About to Shatter All-Time Highs?
- How High Can Bitcoin Go in 2025?
- SUI Token Unlock: SUI Price Prediction After Token Unlock
- Shiba inu News Today
- Pi Coin Skyrockets 40% Amid Buzz Over Major Announcement
- XRP Price Skyrockets — Here’s Why It’s Surging Fast
- 5 Shocking Reasons Why Ethereum Price Is Going Up
- What is Tether AI? How Tether is using AI
- Solana Gets $500M Investments
- 3 Ways to Reduce Gas Fees on Ethereum