

Bitcoin price prediction suggests BTC could target the $110K–$120K range in the short to mid term, supported by strong technical indicators and bullish momentum.
Here’s a detailed Bitcoin (BTC/USDT) Technical Analysis based on the attached 4-hour chart from TradingView:
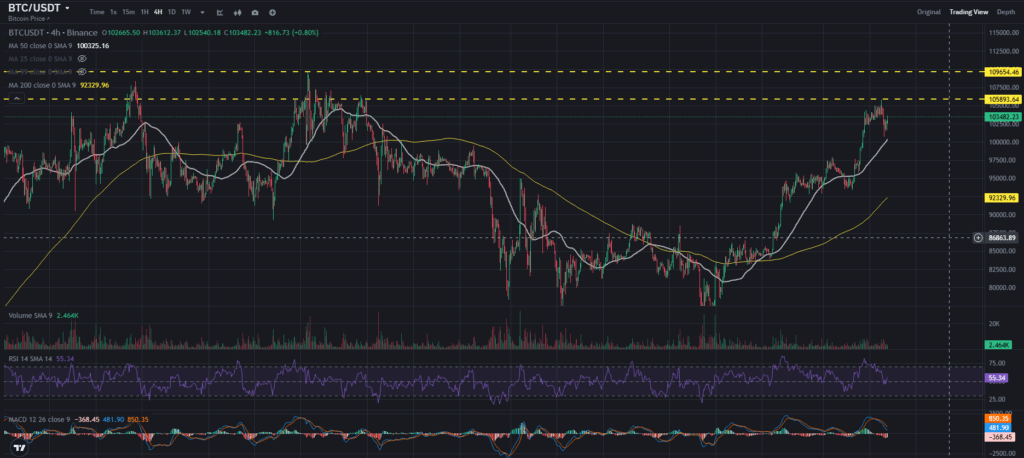
Bitcoin Price Prediction May 13, 2025
Bitcoin Price Analysis (4H Timeframe)
Current Price: $103,460
Change: +$794.82 (+0.77%)
Chart Timeframe: 4H
BTC Key Indicators
1. BTC Moving Averages (MA)
- 50 MA (White): Trending upward, currently supports price momentum.
- 200 MA (Yellow): At ~$100,325, acting as a strong long-term support level.
- The golden cross (50 MA crossing above 200 MA) already occurred earlier in the uptrend, suggesting continued bullish momentum.
2. BTC RSI (Relative Strength Index – 14 SMA):
- Current RSI: 55.23
- This level is neutral to slightly bullish. There’s no sign of overbought pressure yet (above 70), which allows more room for upside without immediate correction.
3. BTC MACD (12, 26, 9):
- MACD Line: 480.15, Signal Line: 850.00, Histogram: -369.85
- MACD has shown strong bullish momentum recently but now reflects slight weakening in momentum as histogram shifts to the downside. A crossover to the downside could signal a potential pullback.
4. BTC Volume Analysis:
- Volume is relatively stable with no extreme spikes. Suggests sustainable price movement without panic buying/selling.
Bitcoin Support and Resistance Levels
| Level | Price | Description |
|---|---|---|
| Resistance 1 | $105,500 | Local high, minor rejection zone |
| Resistance 2 | $110,000 | Psychological barrier, untested zone |
| Support 1 | $100,000 | Strong round-number support, MA cluster |
| Support 2 | $92,300 | Previous accumulation area |
Bitcoin Trend Analysis
- The current price action shows a clear uptrend supported by higher highs and higher lows.
- No current divergence on RSI or MACD, which validates the trend strength, although short-term consolidation is likely.
Short-Term Bitcoin Price Prediction
- As long as BTC holds above $100,000, momentum favors a move toward $105,000–$110,000.
- If RSI climbs above 70 with increasing volume, we may see a mini breakout to new local highs.
- Downside risk is limited unless BTC closes below $100K and loses the 200 MA.
Long-Term Bitcoin Price Outlook
- On a larger timeframe, BTC remains in a macro bullish cycle.
- Holding above the $92,000–$100,000 range confirms strength and supports a potential run toward $120,000+ in the coming months.
- Continued investor interest, ETF inflows, and halving momentum will play critical roles in sustaining this trend.
Bitcoin Price Prediction May 13, 2025
Bitcoin technical analysis suggests that BTC/USDT may be preparing for its next major move as it holds above key support levels near $92,000. On the 4-hour chart, Bitcoin shows strong bullish momentum with a positive RSI and MACD crossover, pointing toward a possible breakout.
Traders analyzing the BTC price forecast short term are closely watching resistance around $110,000 as a crucial level. Many believe Bitcoin is forming a bullish pattern, and questions like “Is Bitcoin going to $120K?” are dominating crypto forums.
This Bitcoin TA for May 2025 offers insights into support and resistance zones, trend reversals, and what’s next for Bitcoin price action based on 4h timeframe. Whether you’re new to crypto or an experienced investor, understanding BTC’s 4H timeframe indicators like RSI and MACD can help you make informed decisions.
Disclaimer: This article is for informational purposes only and does not constitute financial advice. Price predictions are speculative and based on current market data, technical indicators, and sentiment—accuracy is not guaranteed. Always do your own research and consult with a licensed financial advisor before making any investment decisions.
Frequently Asked Questions (FAQ)
Q1. Is now a good time to buy Bitcoin?
If Bitcoin holds above $100K with stable RSI and support from moving averages, it’s considered a healthy uptrend. However, wait for a pullback for better risk-reward.
Q2. What is the immediate resistance for Bitcoin?
Immediate resistance lies at $105,500, with stronger resistance around $110,000.
Q3. What indicators suggest a trend reversal?
A bearish MACD crossover, RSI dropping below 40, and a close below the 200 MA could signal trend weakness or reversal.
Q4. How reliable is this BTC price prediction?
Technical analysis offers a probability-based outlook, not a guarantee. Always combine it with fundamental news and risk management.
Q5. What is the next major price target for Bitcoin?
If current momentum holds, the next major price target is $110,000, followed by $120,000 in the medium to long term.
Latest Crypto News:
- Shiba inu News Today
- Bitcoin Crashes Below $102K After Tariff Truce – Is the Bull Run at Risk?
- Pi Coin Skyrockets 40% Amid Buzz Over Major Announcement
- Shiba Inu (SHIB) Poised for 105% Surge
- Solana’s Meteoric Rise
- XRP Price Skyrockets — Here’s Why It’s Surging Fast
- 5 Shocking Reasons Why Ethereum Price Is Going Up
- What is Tether AI? How Tether is using AI
- Solana Gets $500M Investments
- 3 Ways to Reduce Gas Fees on Ethereum
- $308M Vanishes in Brutal Ether Liquidation
- Rumble Makes Bold Move with $17.1M Bitcoin Investment
- Binance Lands Record-Breaking $2 Billion Crypto Investment from Abu Dhabi’s MGX