
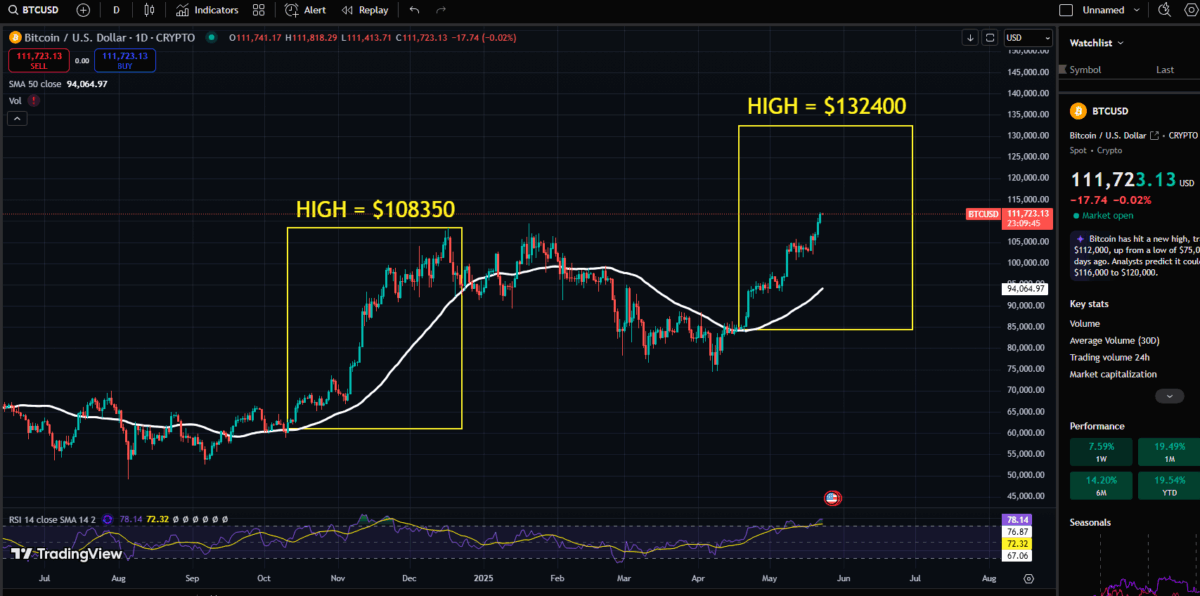
This Bitcoin price prediction is based on the historical breakout pattern above the 50-day Simple Moving Average (SMA). In the past, a similar breakout led to a sharp upward move, and the current price action mirrors that setup. We are sharing BTC breakout analysis with key insights. Bitcoin recently pushing above the 50 SMA (1D) and maintaining momentum, technical analysis suggests a potential target near $132,400, reflecting a proportional gain from the previous breakout cycle.
Previous BTC Breakout Analysis (Oct 2024)
- Breakout Level: Around $61,000
- RSI at Breakout: Just above 72, rising rapidly
- Peak RSI: Reached ~88–90 during the run-up
- Result: RSI stayed elevated (above 70) for most of the rally, indicating strong bullish momentum.
- BTC rallied nearly 77% before topping out around $108,600.
RSI breakout above 70 marked the beginning of a multi-week momentum rally with no major corrections until the very top.
Current BTC Breakout Analysis (May 2025)
- Breakout Level: Around $94,000–$95,000
- RSI at Breakout: Roughly 67–70, rising steadily
- Current RSI: 77.49, similar to where the previous breakout was during early-mid rally
- Current Price: $111,566
- Price Action: BTC has cleared $106K resistance and is pushing higher despite slight RSI overheating
RSI has again broken into the overbought zone (>70) and continues to climb, showing strong bullish strength and continuation potential.
Bitcoin Comparative Analysis based on 50 SMA (1D)
| Metric | Previous Breakout | Current Breakout |
|---|---|---|
| Start Price | ~$61,000 | ~$94,000 |
| RSI at Breakout | ~72 | ~70 |
| Peak RSI | ~88–90 | Currently ~77.5 |
| Price Performance | +77.2% | +~18% so far |
| Structure | Clean move after breakout | Clean follow-through |
| Volume / Momentum | Strong | Increasing |
What This Means for BTC Now:
- The RSI breakout pattern is nearly identical to the last time BTC surged 77%.
- Momentum indicators support the idea that BTC has not topped out yet.
- If history rhymes, the current RSI trajectory suggests BTC could still rally strongly, assuming no macro shocks or selloffs.
⚠️ Caution:
Bitcoin Price Prediction
Based on the repeating pattern, RSI alignment, and SMA breakout structure:
- Short-Term Bullish Target:
$132,400 ($94,000 breakout level) - Aggressive Bullish Case (RSI sustains above 78):
Could overshoot toward $140,000–$150,000, especially with strong macro/inflows. - Support Zone (if pullback):
$106,000–$108,000 (prior top + SMA region) - Pattern Symmetry: The structure of the current rally mirrors the previous one nearly 1:1 in both time and strength.
- Smart Money Confirmation: Breakout from 50-SMA with this RSI strength typically reflects institutional inflow, not retail noise.
Conclusion – BTC Breakout Analysis
If Bitcoin continues to mirror its last breakout:
Price target: $132,400
This projection is realistic and technically supported unless RSI breaks down sharply or BTC fails to hold $106K on any dip.
Disclaimer: This article is for informational purposes only and does not constitute financial advice. Price predictions are speculative and based on current market data, technical indicators, and sentiment—accuracy is not guaranteed. Always do your own research and consult with a licensed financial advisor before making any investment decisions.
Bitcoin News:
- Bitcoin Hits New All-Time High: What’s Next?
- How High Can Bitcoin Go in 2025?
- Ripple to Unlock 1 Billion XRP in June 2025
- Ripple joins Hands With Zand Bank and Mamo
- Is XRP Worth Buying? Can XRP Reach $10?
- Ripple Vs SEC Settlement Rejected
- XRP Price Prediction: Massive XRP Breakout Coming?
- XRP News Today: Ripple About to Shatter All-Time Highs?
- How High Can Bitcoin Go in 2025?
- SUI Token Unlock: SUI Price Prediction After Token Unlock
- Shiba inu News Today
- Pi Coin Skyrockets 40% Amid Buzz Over Major Announcement
- XRP Price Skyrockets — Here’s Why It’s Surging Fast
- 5 Shocking Reasons Why Ethereum Price Is Going Up
- What is Tether AI? How Tether is using AI
- Solana Gets $500M Investments
- 3 Ways to Reduce Gas Fees on Ethereum